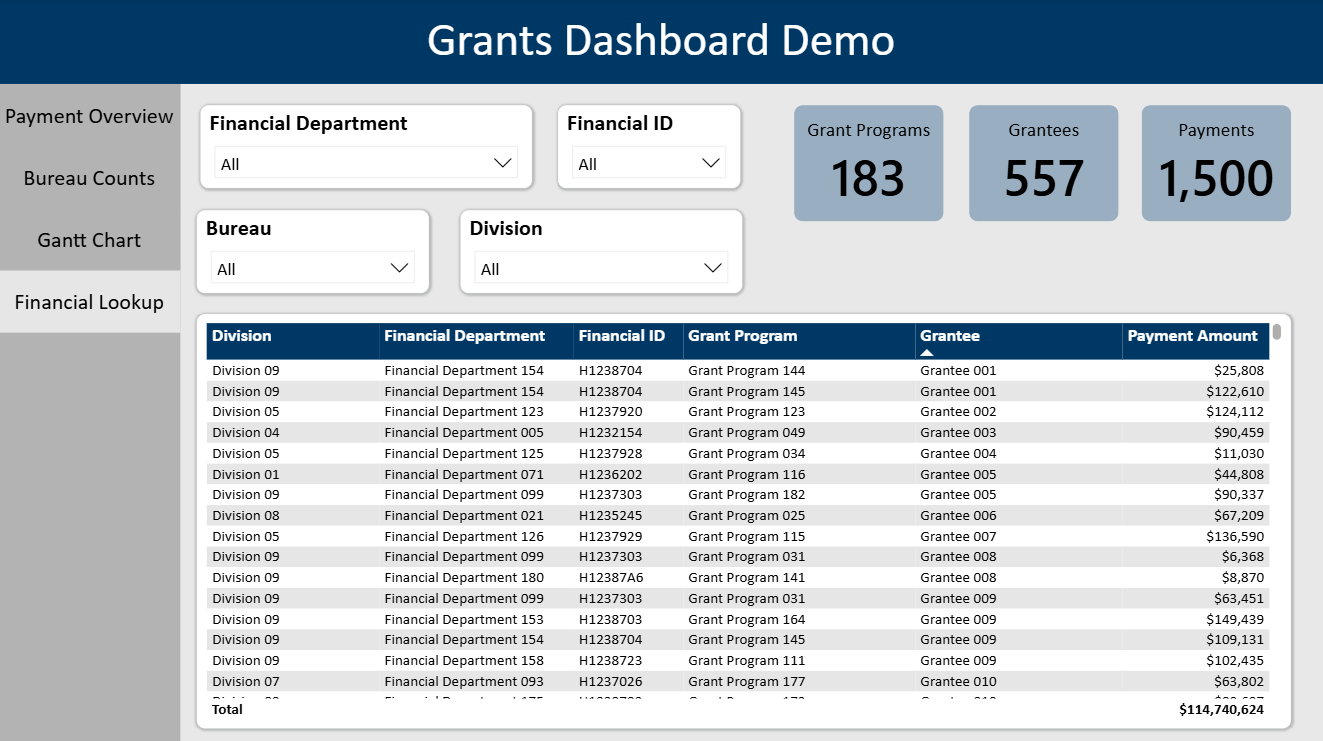
Grants Dashboard
Power BI
About
This is an example Power BI report (dashboard) that summarizes data related to outgoing grant programs. It is modeled off a real project request I completed while partnering with a grants management team. The data are synthetic and all names of the grants, divisions, etc. are masked, such as “Grant Program 001”. Features include visualizations showing payments by organizational area (bureau/division) and grant timelines, a financial department lookup, and various filters. Only screenshots of the report pages are available at this time.
Page 1
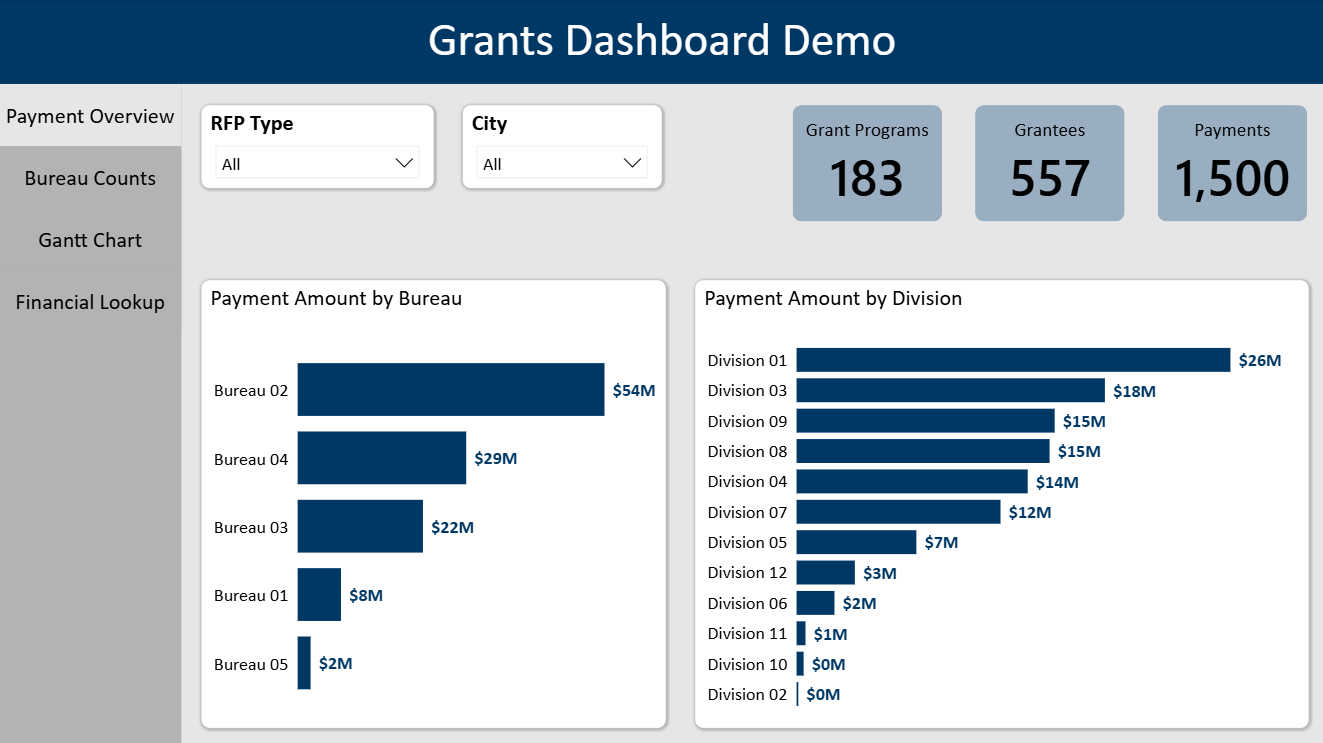
Page 2
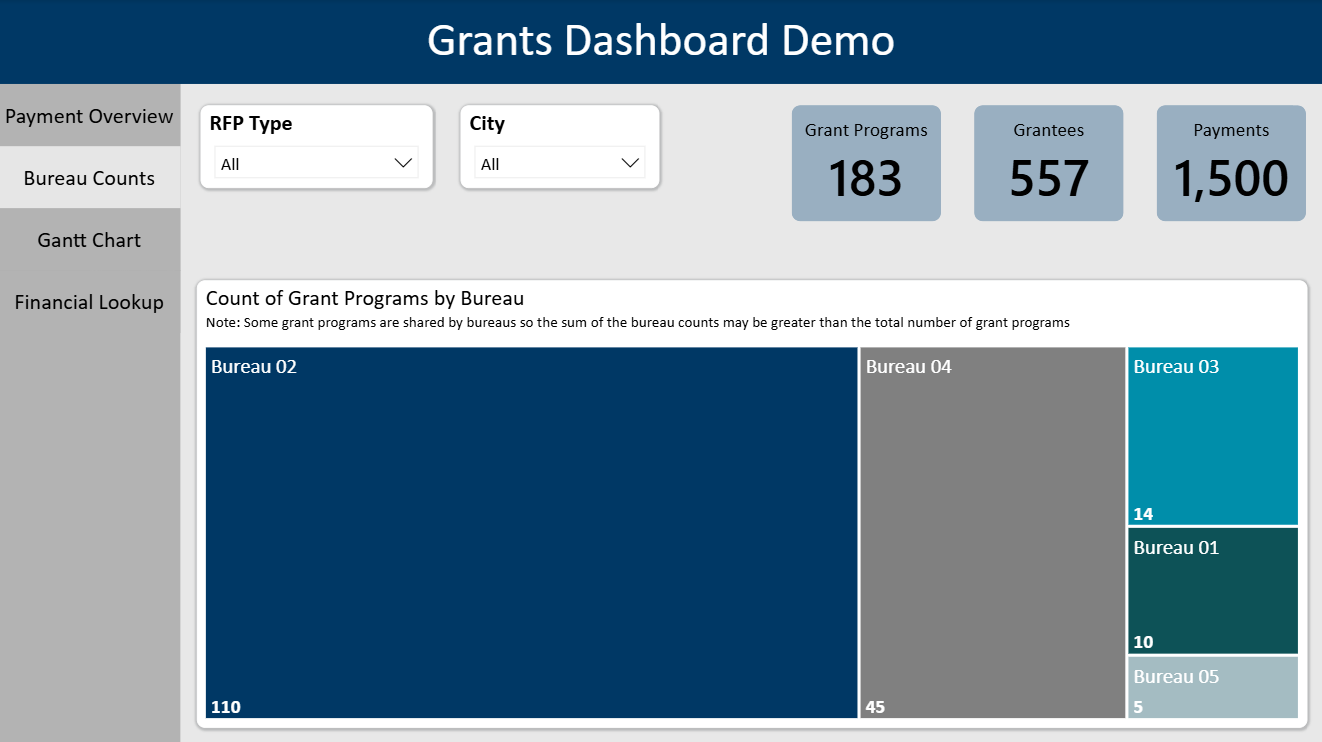
Page 3
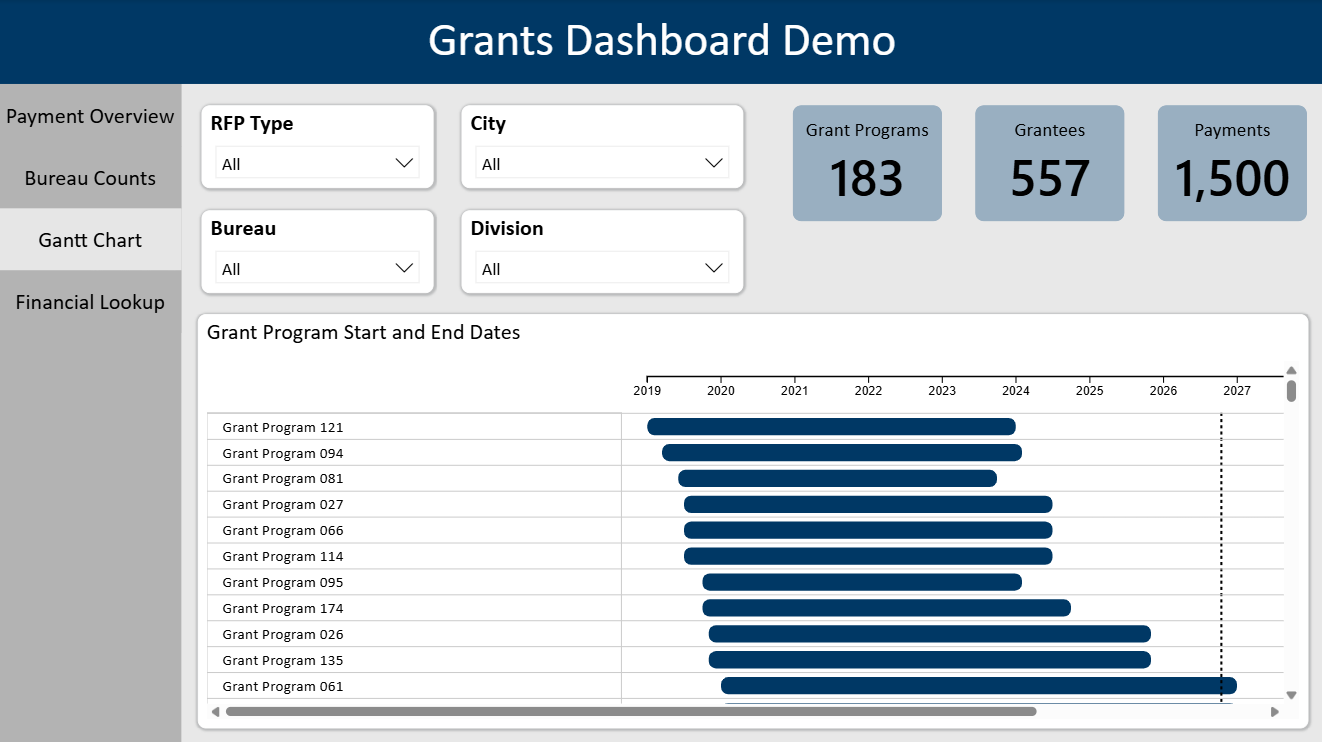
Page 4