Deoxyhemoglobin Analysis
About
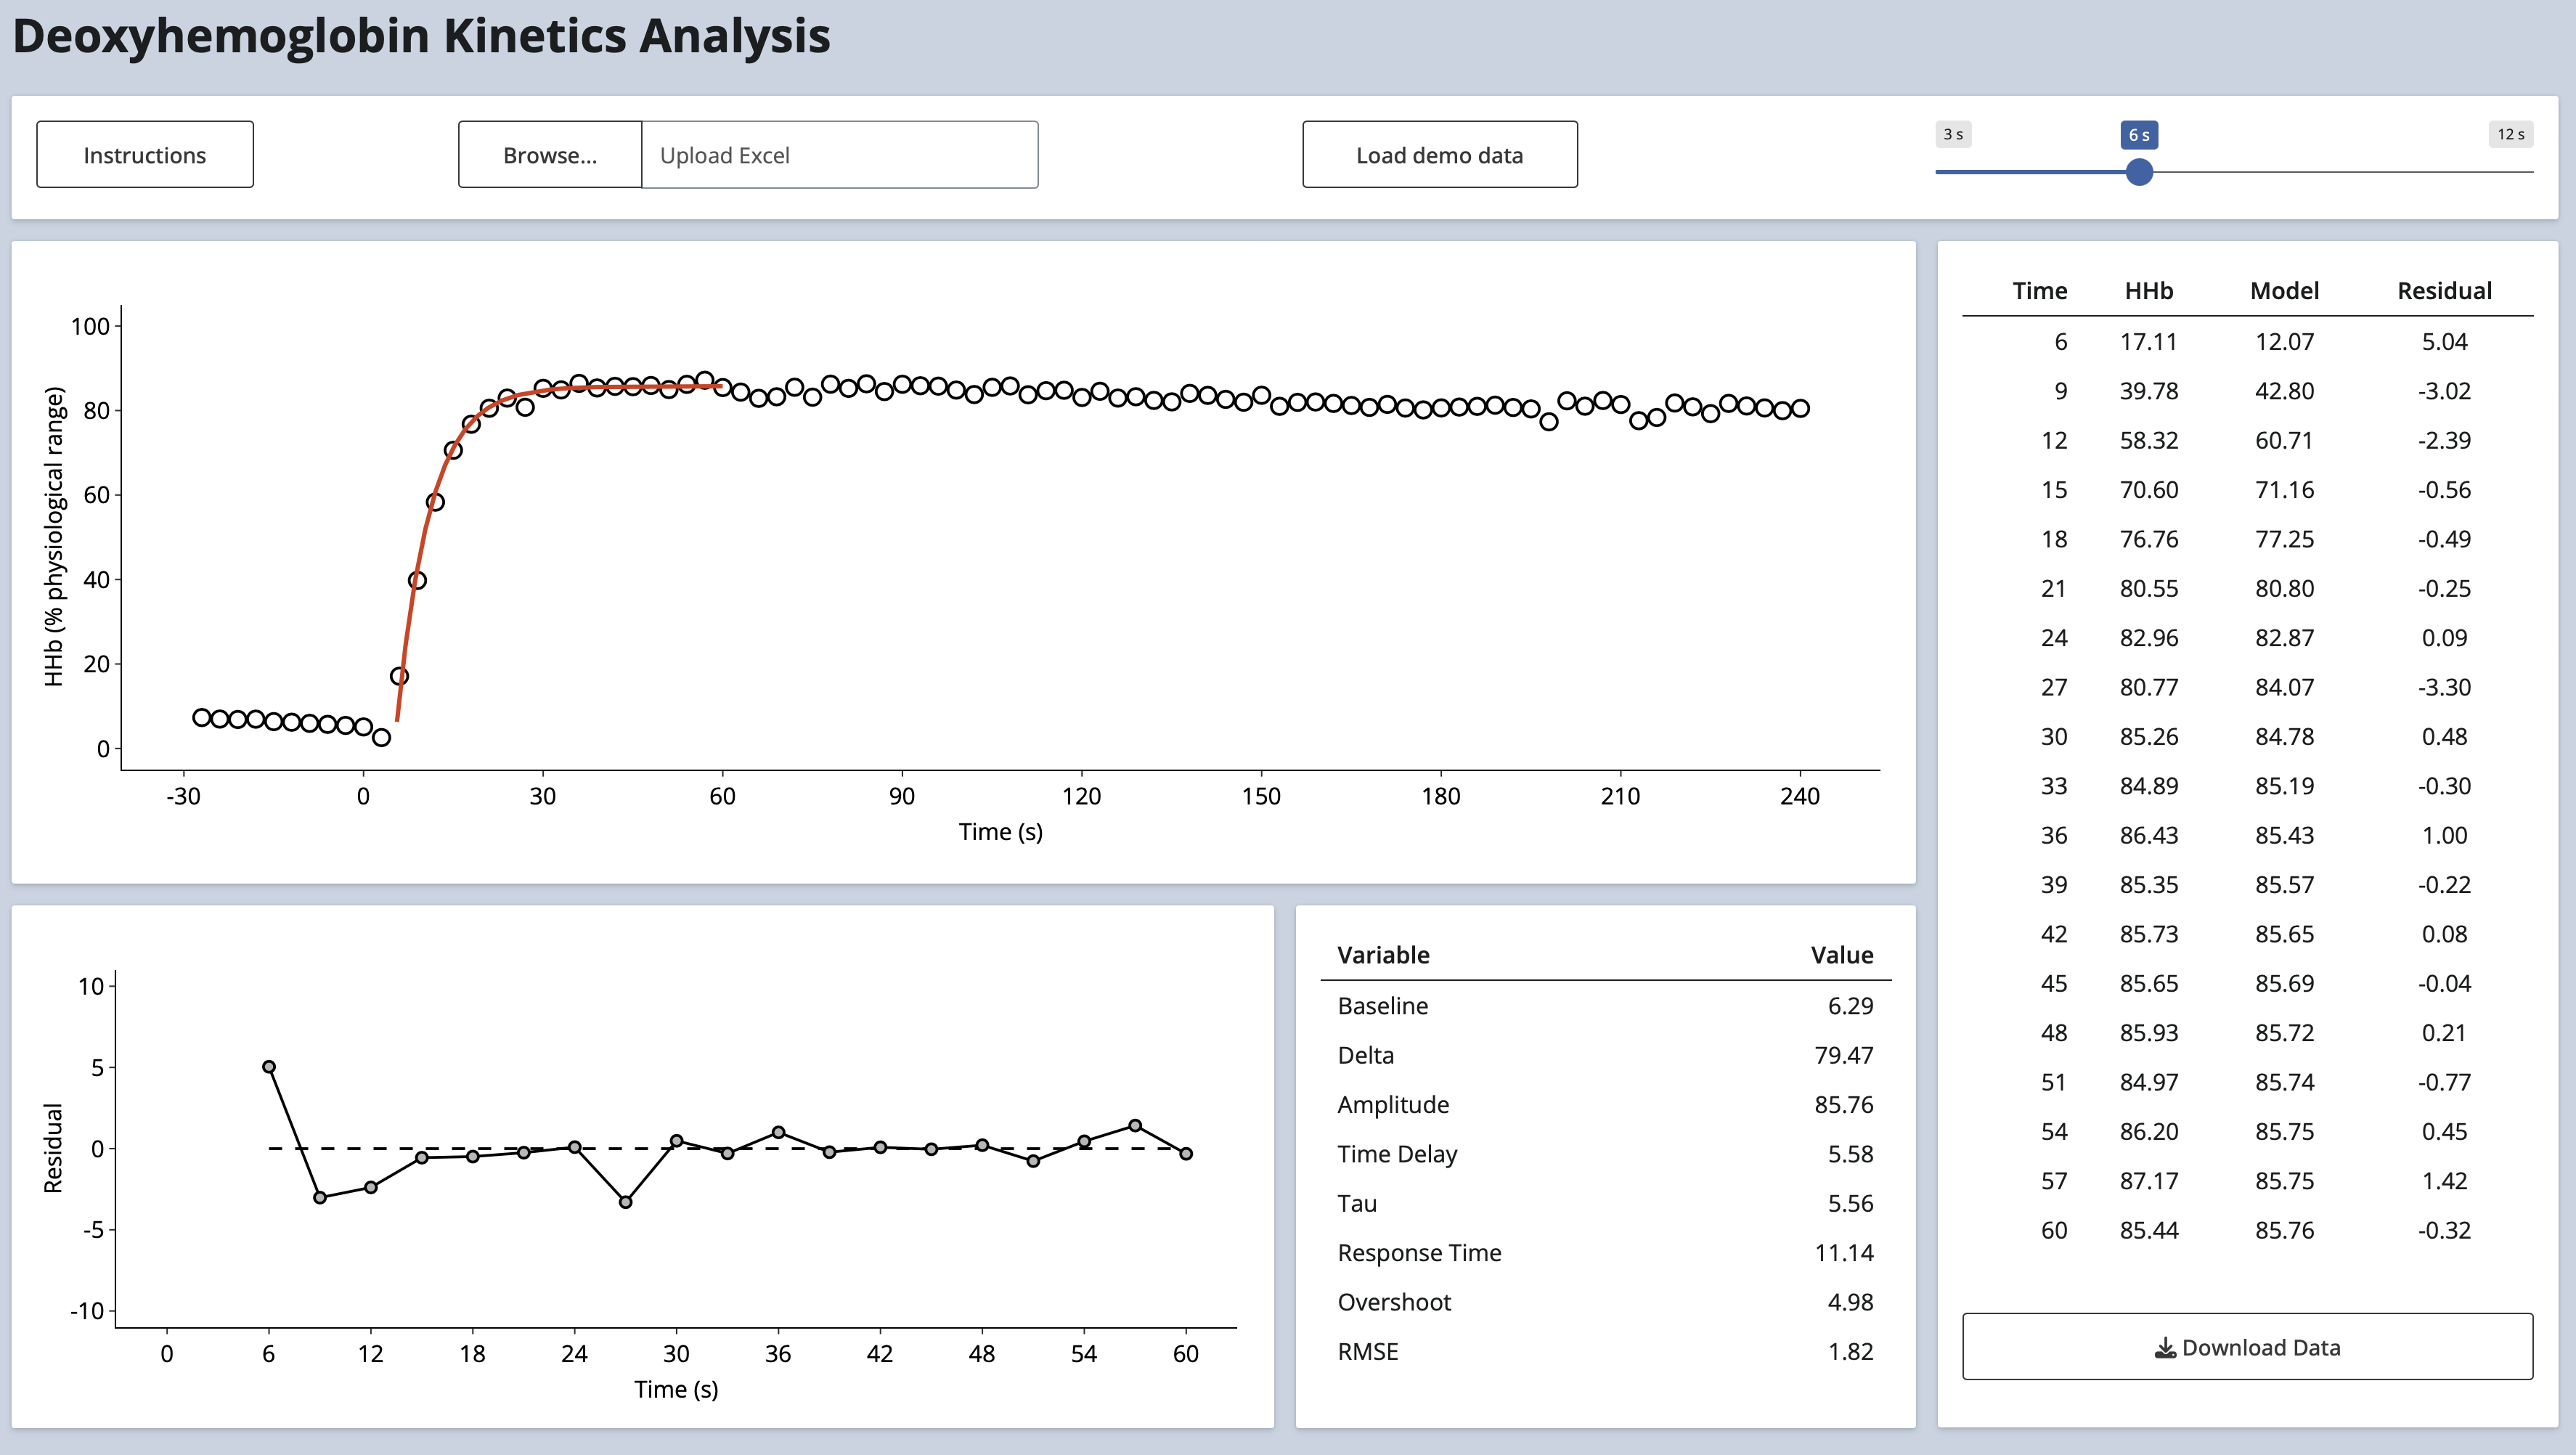
This app performs kinetic modeling of deoxyhemoglobin (HHb) data obtained using near-infrared spectroscopy. The metrics that are calculated provide estimates of microvascular function during the transition from rest to exercise.
I developed the app to improve data analysis accuracy and efficiency. Prior to using this app the research lab I was working in was using a software called SigmaPlot to perform the analysis. Although SigmaPlot is commonly used in research labs for modeling and graphing, it requires the user to click through a long sequence of prompts; thus, it takes more time and is prone to user error. The software licenses are also relatively expensive. Switching to this app cut our analysis time in half and improved data quality.
Methods
The data are fit using a monoexponential model with a time delay according to the equation below:
\[ HHb = {HHb}_{baseline} + \Delta{HHb} \cdot (1 - e^{[-(t - TD) / \tau]}) \]
where HHb is the HHb at any time t, HHbbaselineis the average HHb during the 30 seconds of rest prior to exercise, \(\Delta\) HHb is the difference between the baseline and the steady state amplitude at 60 seconds, t is the time, TD is the time delay, and \(\tau\) (tau) is the time taken to reach 63% of the steady state amplitude.
Three additional variables that are calculated are:
- Response Time - The sum of the time delay and the tau.
- Overshoot - The difference between the amplitude and the average HHb over the final 15 seconds of exercise.
- RMSE - The root mean squared error of the fit.
The timespan of the data used will range from the first fitting point to 60 seconds.
Use
Use the app here: https://timfulton.shinyapps.io/HHb_Analysis_App/
Check out the GitHub repo here: https://github.com/timfulton1/hhb_app